Table of Contents
Getting started #
Thanos provides a global query view, data backup, and historical data access as its core features in a single binary. All three features can be run independently of each other. This allows you to have a subset of Thanos features ready for immediate benefit or testing, while also making it flexible for gradual roll outs in more complex environments.
In this quick-start guide, we will configure Thanos and all components mentioned to work against a Google Cloud Storage bucket. At the moment, Thanos is able to use different storage providers, with the ability to add more providers as necessary.
Thanos will work in cloud native environments as well as more traditional ones. Some users run Thanos in Kubernetes while others on bare metal. More deployments examples and stories will be described soon.
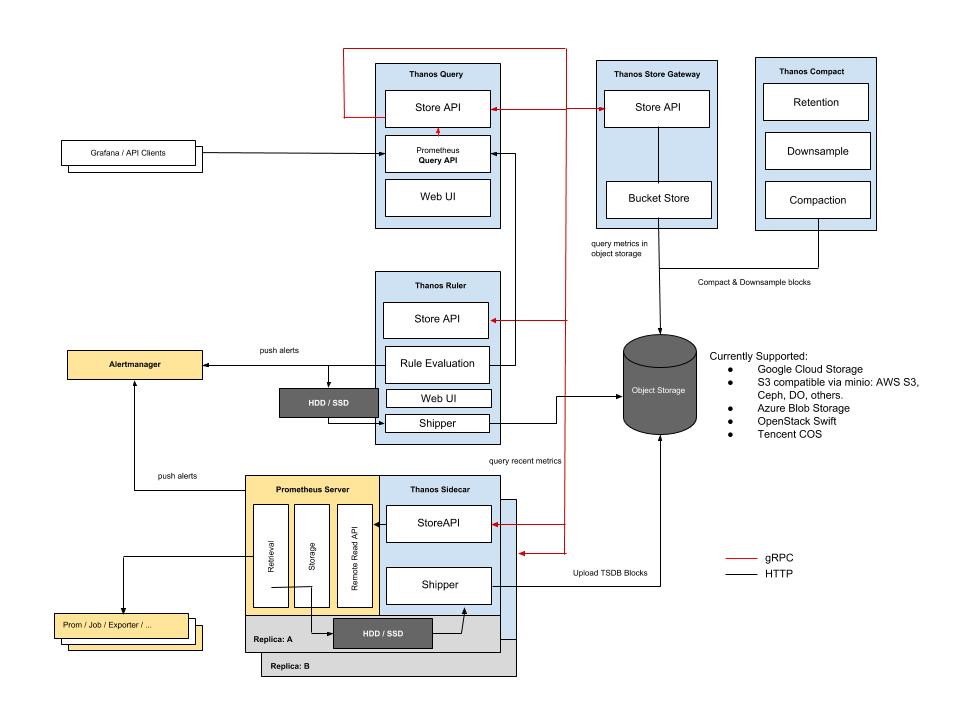
Architecture Overview #
Requirements #
- One or more Prometheus v2.2.1+ installations
- golang 1.10+
- An object storage bucket (optional)
Get Thanos! #
You can find the latest Thanos release here.
If you want to build Thanos from source, make sure you have installed bzr and git. bzr is required, because go modules will use whatever VCS dependency use and in our case a single deps is using bzr. And that you have a working installation of the Go toolchain (GOPATH, PATH=${GOPATH}/bin:${PATH}), Thanos can be downloaded and built by running:
go get -d github.com/improbable-eng/thanos/...
cd ${GOPATH}/src/github.com/improbable-eng/thanos
make
The thanos binary should now be in your $PATH and is the only thing required to deploy any of its components.
You may meet below error:
go: verifying github.com/grpc-ecosystem/go-grpc-middleware@v1.0.0: checksum mismatch
    downloaded: h1:BWIsLfhgKhV5g/oF34aRjniBHLTZe5DNekSjbAjIS6c=
    go.sum:     h1:Iju5GlWwrvL6UBg4zJJt3btmonfrMlCDdsejg4CZE7c=
Makefile:183: recipe for target 'go-mod-tidy' failed
If your golang version is 1.11.4, you can run following cmd then make would pass:
go clean -modcache
If your golang version is below 1.11.4, highly recommend you upgrade to 1.11.4 or above.
Prometheus #
Thanos bases itself on vanilla Prometheus (v2.2.1+).
Here’s the Prometheus’ versions Thanos is tested against:
Components #
Following the KISS and Unix philosophies, Thanos is made of a set of components with each filling a specific role.
- Sidecar: connects to Prometheus and reads its data for query and/or upload it to cloud storage
- Store Gateway: exposes the content of a cloud storage bucket
- Compactor: compact and downsample data stored in remote storage
- Receiver: receives data from Prometheus’ remote-write WAL, exposes it and/or upload it to cloud storage
- Ruler: evaluates recording and alerting rules against data in Thanos for exposition and/or upload
- Query Gateway: implements Prometheus’ v1 API to aggregate data from the underlying components
Sidecar #
Thanos integrates with existing Prometheus servers through a Sidecar process, which runs on the same machine or in the same pod as the Prometheus server.
The purpose of the Sidecar is to backup Prometheus data into an Object Storage bucket, and giving other Thanos components access to the Prometheus instance the Sidecar is attached to via a gRPC API.
The Sidecar makes use of the reload Prometheus endpoint. Make sure it’s enabled with the flag --web.enable-lifecycle.
External storage #
The following configures the sidecar to write Prometheus’ data into a configured object storage:
thanos sidecar \
    --tsdb.path            /var/prometheus \          # TSDB data directory of Prometheus
    --prometheus.url       "http://localhost:9090" \  # Be sure that the sidecar can use this url!
    --objstore.config-file bucket_config.yaml \       # Storage configuration for uploading data
The format of YAML file depends on the provider you choose. Examples of config and up-to-date list of storage types Thanos supports is available here.
Rolling this out has little to zero impact on the running Prometheus instance. It is a good start to ensure you are backing up your data while figuring out the other pieces of Thanos.
If you are not interested in backing up any data, the --objstore.config-file flag can simply be omitted.
- Example Kubernetes manifest
- Example Kubernetes manifest with Minio upload
- Example Deploying sidecar using official Prometheus Helm Chart
- Details & Config for other object stores
Store API #
The Sidecar component implements and exposes a gRPC Store API. The sidecar implementation allows you to query the metric data stored in Prometheus.
Let’s extend the Sidecar in the previous section to connect to a Prometheus server, and expose the Store API.
thanos sidecar \
    --tsdb.path                 /var/prometheus \
    --objstore.config-file      bucket_config.yaml \       # Bucket config file to send data to
    --prometheus.url            http://localhost:9090 \    # Location of the Prometheus HTTP server
    --http-address              0.0.0.0:19191 \            # HTTP endpoint for collecting metrics on the Sidecar
    --grpc-address              0.0.0.0:19090              # GRPC endpoint for StoreAPI
External Labels #
Prometheus allows the configuration of “external labels” of a given Prometheus instance. These are meant to globally identify the role of that instance. As Thanos aims to aggregate data across all instances, providing a consistent set of external labels becomes crucial!
Every Prometheus instance must have a globally unique set of identifying labels. For example, in Prometheus’s configuration file:
global:
  external_labels:
    region: eu-west
    monitor: infrastructure
    replica: A
Query Gateway #
Now that we have setup the Sidecar for one or more Prometheus instances, we want to use Thanos’ global Query Layer to evaluate PromQL queries against all instances at once.
The Query component is stateless and horizontally scalable and can be deployed with any number of replicas. Once connected to the Sidecars, it automatically detects which Prometheus servers need to be contacted for a given PromQL query.
Query also implements Prometheus’s official HTTP API and can thus be used with external tools such as Grafana. It also serves a derivative of Prometheus’s UI for ad-hoc querying and stores status.
Below, we will set up a Query to connect to our Sidecars, and expose its HTTP UI.
thanos query \
    --http-address 0.0.0.0:19192 \                                # HTTP Endpoint for Query UI
    --store        1.2.3.4:19090 \                                # Static gRPC Store API Address for the query node to query
    --store        1.2.3.5:19090 \                                # Also repeatable
    --store        dnssrv+_grpc._tcp.thanos-store.monitoring.svc  # Supports DNS A & SRV records
Go to the configured HTTP address that should now show a UI similar to that of Prometheus. If the cluster formed correctly you can now query across all Prometheus instances within the cluster. You can also check the Stores page to check up on your stores.
Deduplicating Data from Prometheus HA pairs #
The Query component is also capable of deduplicating data collected from Prometheus HA pairs. This requires configuring Prometheus’s global.external_labels configuration block (as mentioned in the External Labels section) to identify the role of a given Prometheus instance.
A typical choice is simply the label name “replica” while letting the value be whatever you wish. For example, you might set up the following in Prometheus’s configuration file:
global:
  external_labels:
    region: eu-west
    monitor: infrastructure
    replica: A
# ...
In a Kubernetes stateful deployment, the replica label can also be the pod name.
Reload your Prometheus instances, and then, in Query, we will define replica as the label we want to enable deduplication to occur on:
thanos query \
    --http-address        0.0.0.0:19192 \
    --store               1.2.3.4:19090 \
    --store               1.2.3.5:19090 \
    --query.replica-label replica  # Replica label for de-duplication
Go to the configured HTTP address, and you should now be able to query across all Prometheus instances and receive de-duplicated data.
Communication Between Components #
The only required communication between nodes is for Thanos Querier to be able to reach gRPC storeAPIs you provide. Thanos Querier periodically calls Info endpoint to collect up-to-date metadata as well as checking the health of given StoreAPI. The metadata includes the information about time windows and external labels for each node.
There are various ways to tell query component about the StoreAPIs it should query data from. The simplest way is to use a static list of well known addresses to query. These are repeatable so can add as many endpoint as needed. You can put DNS domain prefixed by dns+ or dnssrv+ to have Thanos Query do an A or SRV lookup to get all required IPs to communicate with.
thanos query \
    --http-address 0.0.0.0:19192 \              # Endpoint for Query UI
    --grpc-address 0.0.0.0:19092 \              # gRPC endpoint for Store API
    --store        1.2.3.4:19090 \              # Static gRPC Store API Address for the query node to query
    --store        1.2.3.5:19090 \              # Also repeatable
    --store        dns+rest.thanos.peers:19092  # Use DNS lookup for getting all registered IPs as separate StoreAPIs
Read more details here.
Store Gateway #
As the sidecar backs up data into the object storage of your choice, you can decrease Prometheus retention and store less locally. However we need a way to query all that historical data again. The store gateway does just that by implementing the same gRPC data API as the sidecars but backing it with data it can find in your object storage bucket. Just like sidecars and query nodes, the store gateway exposes StoreAPI and needs to be discovered by Thanos Querier.
thanos store \
    --data-dir             /var/thanos/store \   # Disk space for local caches
    --objstore.config-file bucket_config.yaml \  # Bucket to fetch data from
    --http-address         0.0.0.0:19191 \       # HTTP endpoint for collecting metrics on the Store Gateway
    --grpc-address         0.0.0.0:19090         # GRPC endpoint for StoreAPI
The store gateway occupies small amounts of disk space for caching basic information about data in the object storage. This will rarely exceed more than a few gigabytes and is used to improve restart times. It is useful but not required to preserve it across restarts.
Compactor #
A local Prometheus installation periodically compacts older data to improve query efficiency. Since the sidecar backs up data as soon as possible, we need a way to apply the same process to data in the object storage.
The compactor component simple scans the object storage and processes compaction where required. At the same time it is responsible for creating downsampled copies of data to speed up queries.
thanos compact \
    --data-dir             /var/thanos/compact \  # Temporary workspace for data processing
    --objstore.config-file bucket_config.yaml \   # Bucket where to apply the compacting
    --http-address         0.0.0.0:19191          # HTTP endpoint for collecting metrics on the Compactor
The compactor is not in the critical path of querying or data backup. It can either be run as a periodic batch job or be left running to always compact data as soon as possible. It is recommended to provide 100-300GB of local disk space for data processing.
NOTE: The compactor must be run as a singleton and must not run when manually modifying data in the bucket.
Ruler #
In case of Prometheus with Thanos sidecar does not have enough retention, or if you want to have alerts or recording rules that requires global view, Thanos has just the component for that: the Ruler, which does rule and alert evaluation on top of a given Thanos Querier.
Receiver #
TBD
Extras #
Thanos also has a tutorial on deploying it to Kubernetes. We have a full page describing a standard deployment here.
We also have example Grafana dashboards here and some alerts to get you started.