Query Logging for Thanos
- Status
- Owner
- @yashrsharma44
Related Tickets
- Add Query Logging: https://github.com/thanos-io/thanos/issues/1706
Summary
This proposal describes configuring a new internal feature: Query logging for various types of queries in Thanos.
We will go through the problem statement, use-cases and potential solution for the same.
Problem Statement / Motivation
Conceptually and at a very high level, Thanos is a durable and cheap database, storing a very large amount of metric data in external object storage. This has the possible implication of having expensive data queries if the amount of data required to be queried is large. Even after local optimisations and efficient indexing, still querying a large amount of data is very resource-intensive, and unless the user knows what he/she is doing, it can be very expensive.
Different types of Query Logging are useful as a feature in Thanos, which would help in improving the developer experience.
One of such feature is Active Query Logging which helps in tracking all the active queries made in a database, and helps the users in knowing/debugging what queries made were resource-intensive, and how they can use the details to further optimise the database, or from the user’s perspective, to draw out the line from making such a request.
A similar feature exists in Prometheus, here is a description of an active Query Log [1] -
level=info ts=2019-08-28T14:30:09.142Z caller=main.go:329 msg="Starting Prometheus" version="(version=2.12.0, branch=HEAD, revision=43acd0e2e93f9f70c49b2267efa0124f1e759e86)"
level=info ts=2019-08-28T14:30:09.142Z caller=main.go:330 build_context="(go=go1.12.8, user=root@7a9dbdbe0cc7, date=20190818-13:53:16)"
level=info ts=2019-08-28T14:30:09.142Z caller=main.go:331 host_details="(Linux 4.15.0-55-generic #60-Ubuntu SMP Tue Jul 2 18:22:20 UTC 2019 x86_64 mari (none))"
level=info ts=2019-08-28T14:30:09.142Z caller=main.go:332 fd_limits="(soft=1000000, hard=1000000)"
level=info ts=2019-08-28T14:30:09.142Z caller=main.go:333 vm_limits="(soft=unlimited, hard=unlimited)"
level=info ts=2019-08-28T14:30:09.143Z caller=query_logger.go:74 component=activeQueryTracker msg="These queries didn't finish in prometheus' last run:" queries="[{\"query\":\"changes(changes(prometheus_http_request_duration_seconds_bucket[1h:1s])[1h:1s])\",\"timestamp_sec\":1567002604}]"
level=info ts=2019-08-28T14:30:09.144Z caller=main.go:654 msg="Starting TSDB ..."level=info
Here, we can see that this log was taken before the Prometheus instance died unnaturally, and the query logged under the component ActiveQueryTracker, logs the respective query that did the damage. Even though it does not pin-points the exact issue that created the problem, still it is quite helpful in considering this issue as one of the potential queries that led to the unnatural death of the Prometheus instance.
Another requirement is using Audit and Adaptive Logging in Thanos. This is a useful feature, as the former helps in aggregating all the queries made until now, and that can be utilised to track down and provide a comprehensive overview of what is happening. Audit logs can help in capturing the flow of requests made, thus we can track line to line flow of queries which can be helpful in describing the observed behaviour of a request. More info - https://rollout.io/blog/audit-logs/
    {
      protoPayload: {
        @type: "type.googleapis.com/google.cloud.audit.AuditLog",
        status: {},
        authenticationInfo: {
          principalEmail: "user@example.com"
        },
        serviceName: "appengine.googleapis.com",
        methodName: "SetIamPolicy",
        authorizationInfo: [...],
        serviceData: {
          @type: "type.googleapis.com/google.appengine.legacy.AuditData",
          policyDelta: { bindingDeltas: [
              action: "ADD",
              role: "roles/logging.privateLogViewer",
              member: "user:user@example.com"
          ], }
        },
        request: {
          resource: "my-gcp-project-id",
          policy: { bindings: [...], }
        },
        response: {
          bindings: [
            {
              role: "roles/logging.privateLogViewer",
              members: [ "user:user@example.com" ]
            }
          ],
        }
      },
      insertId: "53179D9A9B559.AD6ACC7.B40604EF",
      resource: {
        type: "gcp_app",
        labels: { project_id: "my-gcp-project-id" }
      },
      timestamp: "2019-05-27T16:24:56.135Z",
      severity: "NOTICE",
      logName: "projects/my-gcp-project-id/logs/cloudaudit.googleapis.com%2Factivity",
    }
Taken from - https://cloud.google.com/logging/docs/audit/understanding-audit-logs
Example of an audit logging
Adaptive Logging is quite useful, as we can log all queries based upon fulfilling a certain criteria/filters, and later those can be used for inspecting abnormal queries and improving the user experience overall.
Proposal
Query Logging in Thanos
The proposal for Query Logging has been divided into two major parts - Audit Logging and Adaptive Logging. Audit and Adaptive Logging would be implemented across the Store API level, and would also cover the HTTP APIs of querier and other components that use HTTP APIs.
Each of the use case of the sub-part would be described and a possible implementation would be discussed -
Using Middlewares
Since Middlewares are a good chunk of the implementation, it makes sense to discuss briefly about -
- How we are going to use the middlewares in our logging.
- How can users can configure it?
- Discuss the policy of logging by the middlewares.
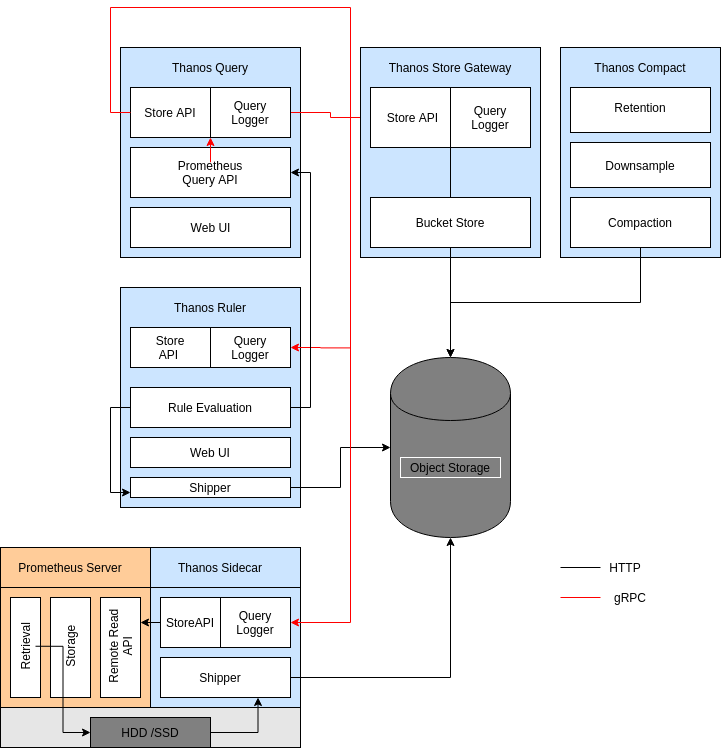
Usage of Middlewares : As it has been suggested by the diagram above, we plan to put in interceptors/middlewares to intercept the connection for a server implementation.
The middlewares helps in intercepting the queries flowing before a client, and all the queries leaving the server.
The middlewares provide a nice abstraction to log the queries because we have the following objective from the logging -
- Log all the queries.
- Log some specific queries.
- Logging at a certain level(Debug / Info).
- Have a same request-id for a given request.
All of the goals are easily possible using grpc middlewares, as the grpc-ecosystem has a nice set of middlewares that makes the above possible, so we can just plug and play our middlewares
For HTTP, all these nice middlewares are not present, so we need to code up our implementation performing the same logic.
User specific configurations : Currently we are going to provide the following user facing configurations for using the request logger -
- Use pre-defined adaptive logging policy.
- The Adaptive Logging policy plans to include logging of only requests that return an error, or crosses a specific duration of time.
- The level for all requests is
INFO. Error, however would be logged at theERRORlevel. - We would add in a flag to turn on/off request logging.
- Request Logging would be turned off by default, and default logging would be in stdout. For logging all the requests, we would accept a flag for the enabling the same.
- Currently the policy for request logging is hard-coded, may be extended as a user based policy later.
Policy of Request Logging : We are going to use the following middleware decider for achieving the above objectives -
logging.WithDecider- Thisoptionwould help us in deciding the logic whether a given request should be logged or not. This should help in logging specific / all queries. It is all pre request interception.logging.WithLevels- Thisoptionwould help us in fixating the level of query that we might want to log. So based on a query hitting a certain criteria, we can switch the levels of it.- For using the request-id, we can store the request-id in the metadata of the
context, and while logging, we can use it. - Same equivalent for the HTTP can be implemented for mirroring the logic of gRPC middlewares.
- So we would generally have request logging and options:
- No request logging.
- Log Finish call of the request.
- Log start and finish call - Audit Log.
Request Logging
Query Logging in Thanos would be implemented as a one logger, Request Logger. This is done in considering that Adaptive is a specific case of Audit Logging, and would make sense to keep the similar logical components together, rather than creating another distinction between them. We might however discuss the specific sub-cases of the request logging, namely adaptive and audit logging for enumerating the purpose of it.
Use case 1: Audit Logging
Audit logging is a kind of logging, where we log in every internal API requests. Typically, rather than logging in specific queries, we ought to log in every query that has been made until now.
From a developer’s perspective, audit logs can keep you sane by giving you some insight into how a complex system arrived at its current state. Developers are typically fond of state diagrams and deterministic outcomes. An audit log that shows that a person or process applied a change can give developers valuable insight.
Implementation:
- Currently, we are looking to implement Audit Logging at the StoreAPI level.
- We will use a middleware to intercept all the queries made to the StoreAPI.
- As StoreAPI is interconnected with each of the other components, we can leverage this to provide a Global overview of different queries which would be useful for auditing purposes.
- We would use a custom decider for logging all the requests.
Use case 2: Adaptive Logging
Adaptive logging is totally different from the Audit Logging. Out here in adaptive logging, we would log only certain queries which satisfies a certain policy/satisfies a certain condition. Possible filters could be, queries making an invalid request, latency time crossing a certain barrier, and so on.
Implementation:
- Along with audit logging, we are looking to implement the Adaptive Logging at the StoreAPI level.
- We can leverage middlewares to intercept and filter the queries for logging, which satisfies the given policy.
- We can achieve Global overview of the logs, due to the StoreAPI being interconnected with the other components.
- We would use a custom decider to log certain methods, based on the logging policy defined.
Use case 3:
Common Use case to all
Tracking queries across different components The current implementation provides addition for tracking requests across different components of Thanos. Since we are logging the queries at the StoreAPI level, and those queries are flowing from one component to another, the only way to track them would be to have a request-id, which would help in tracking the logs of an individual query between different component. Another use-case would be to have a correlation of logs based on queries, so the request-id also serves the same purpose.
Implementation
- Since Thanos has a solid tracing infrastructure in place, we can re-use the tracing-id for a given request, and thus we can track the request across the different components.
In case tracing is disabled, we can use our implementation of generating a request-id on the fly for a given request.
Alternatives
Use Active Queries in StoreAPI
This is not possible due to the distributed nature of Thanos. It has a lot of moving parts, and with the current implementation of ActiveQueryLogging, it is best used as a local logger for each component.
Adding logfiles for storing the logs of request logging separately
The implementation of request logger makes it logical to log the request logs into a separate file. However, we should not embed the log writing logic inside Thanos, described here - https://12factor.net/logs
Don’t add anything
This proposal adds in a new feature for Thanos, so there isn’t any alternative until now that would solve our problem.
Non Goals
- Query logging part would help in debugging the internal requests made.
- This provides ample of insights about possible bottle-neck of individual components of Thanos.
- Active Query Logging -
Currently, the implementation of Active Query Logging seems flaky, as it is quite difficult to achieve a consistent logging of active queries after a forced shutdown. Considering the probability of logs correctly getting logged, the cons of the logging outweighs the pros, and hence would be sensible to discuss the implementation after the initial goals are achieved.
As the name suggests, this logger logs all the current active logs that are running in a component. This type of logging is aimed at providing logs of the active queries that are running currently in an component. This logger would be local to each component, and would run as a standalone for each component in contrast to the other two loggers. This logger would help in debugging queries which led to the component instanced OOM killed, or helping in tracking queries which are taking too long. The purpose of this logger can clash with the above two, but this logger is solely focused on providing active queries that are running, much like Prometheus does.
Implementation of Active Query Tracking
// This would be local to each component, so each component would log all the active queries
type ActiveQueryLogging struct {

	// mmapped file to store the queries.
	mmappedFile []byte
	// channel to generate the next available index, much like Python’s generator indexing
	getNextIndex chan int
	// logger, different from the usual one
	logger log.Logger
}
This interface is designed with some ideas from a similar interface designed for Prometheus Query Logger[2]. Here is a rough algorithm that would implement the Query Logging in Thanos -
1) Thanos receives a query.
2) It calls the index_generator, which is a Python-style generator that will generate natural numbers from 0(or 1) indicating the byte index at which to put the information about the query in the log file. This would ensure that the key remains unique for each of the queries logged.
3) The log file would be a memory-mapped file, which would help in accessing a random position for logging the query in constant time.
This algorithm has been heavily derived from this pull request[3] and would suggest referring this for the implementation of the same.
Work Plan
- Complete the proposal.
- Roll out grpc-middlewareV2.
- Implement a grpc-interceptor for Store API currently(this might be extended for other APIs as well).
- Write up the grpc logging middleware along with the policies.
- Write up an equivalent http middleware for the logging of requests in http APIs.
- Finish up with the tests if required.