Table of Contents
Tracing #
Thanos supports different tracing backends that implements opentracing.Tracer interface.
All clients are configured using --tracing.config-file to reference to the configuration file or --tracing.config to put yaml config directly.
How to use config flags? #
You can either pass YAML file defined below in --tracing.config-file or pass the YAML content directly using --tracing.config. We recommend the latter as it gives an explicit static view of configuration for each component. It also saves you the fuss of creating and managing additional file.
Don’t be afraid of multiline flags!
In Kubernetes it is as easy as (using Thanos sidecar example):
      - args:
        - sidecar
        - |
          --objstore.config=type: GCS
          config:
            bucket: <bucket>
        - --prometheus.url=http://localhost:9090
        - |
          --tracing.config=type: STACKDRIVER
          config:
            service_name: ""
            project_id: <project>
            sample_factor: 16
        - --tsdb.path=/prometheus-data
How to add a new client? #
- Create new directory under
pkg/tracing/<provider> - Implement
opentracing.Tracerinterface - Add client implementation to the factory in factory code. (Using as small amount of flags as possible in every command)
- Add client struct config to cfggen to allow config auto generation.
At that point, anyone can use your provider by spec.
See this issue to check our progress on moving to OpenTelemetry Go client library.
Usage #
Once tracing is enabled and sampling per backend is configured, Thanos will generate traces for all gRPC and HTTP APIs thanks to generic “middlewares”. Some more interesting to observe APIs like query or query_range have more low-level spans with focused metadata showing latency for important functionalities. For example, Jaeger view of HTTP query_range API call might look as follows:
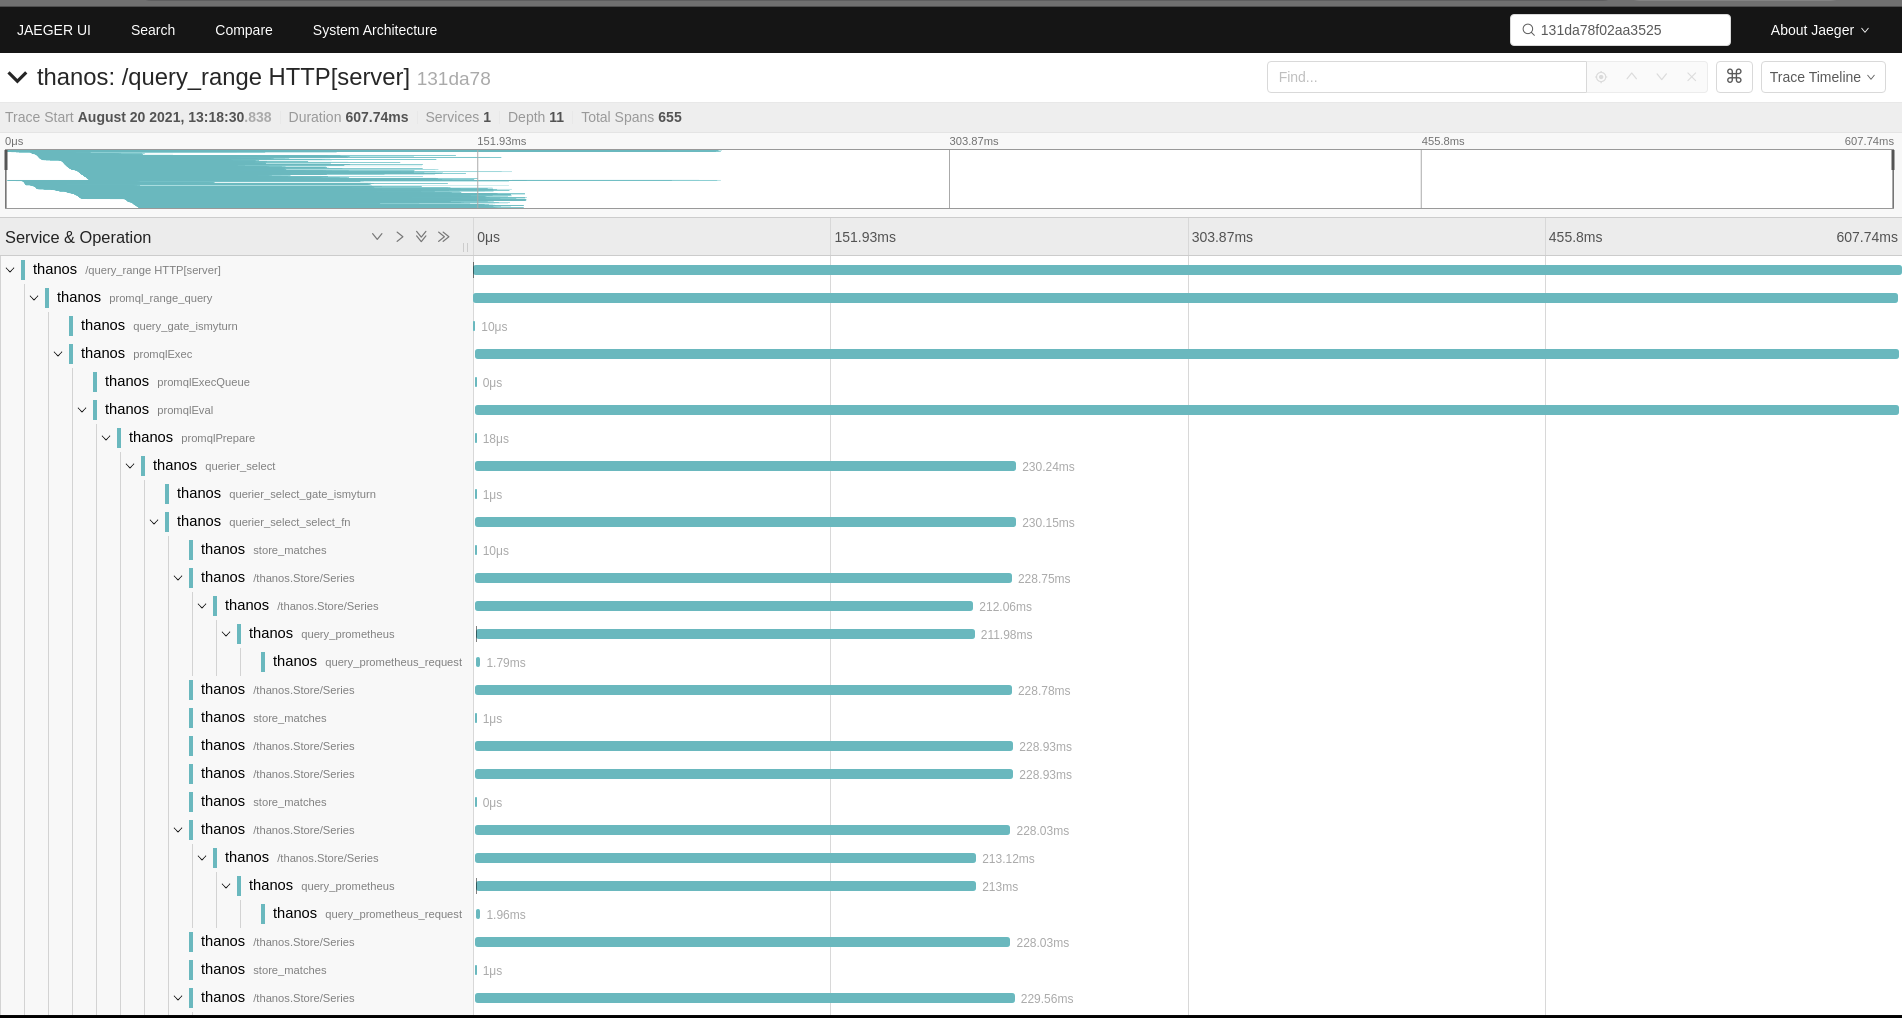
As you can see it contains both HTTP request and spans around gRPC request, since Querier calls gRPC services to get fetch series data.
Each Thanos component generates spans related to its work and sends them to central place e.g Jaeger or OpenTelemetry collector. Such place is then responsible to tie all spans to a single trace, showing a request execution path.
Obtaining Trace ID #
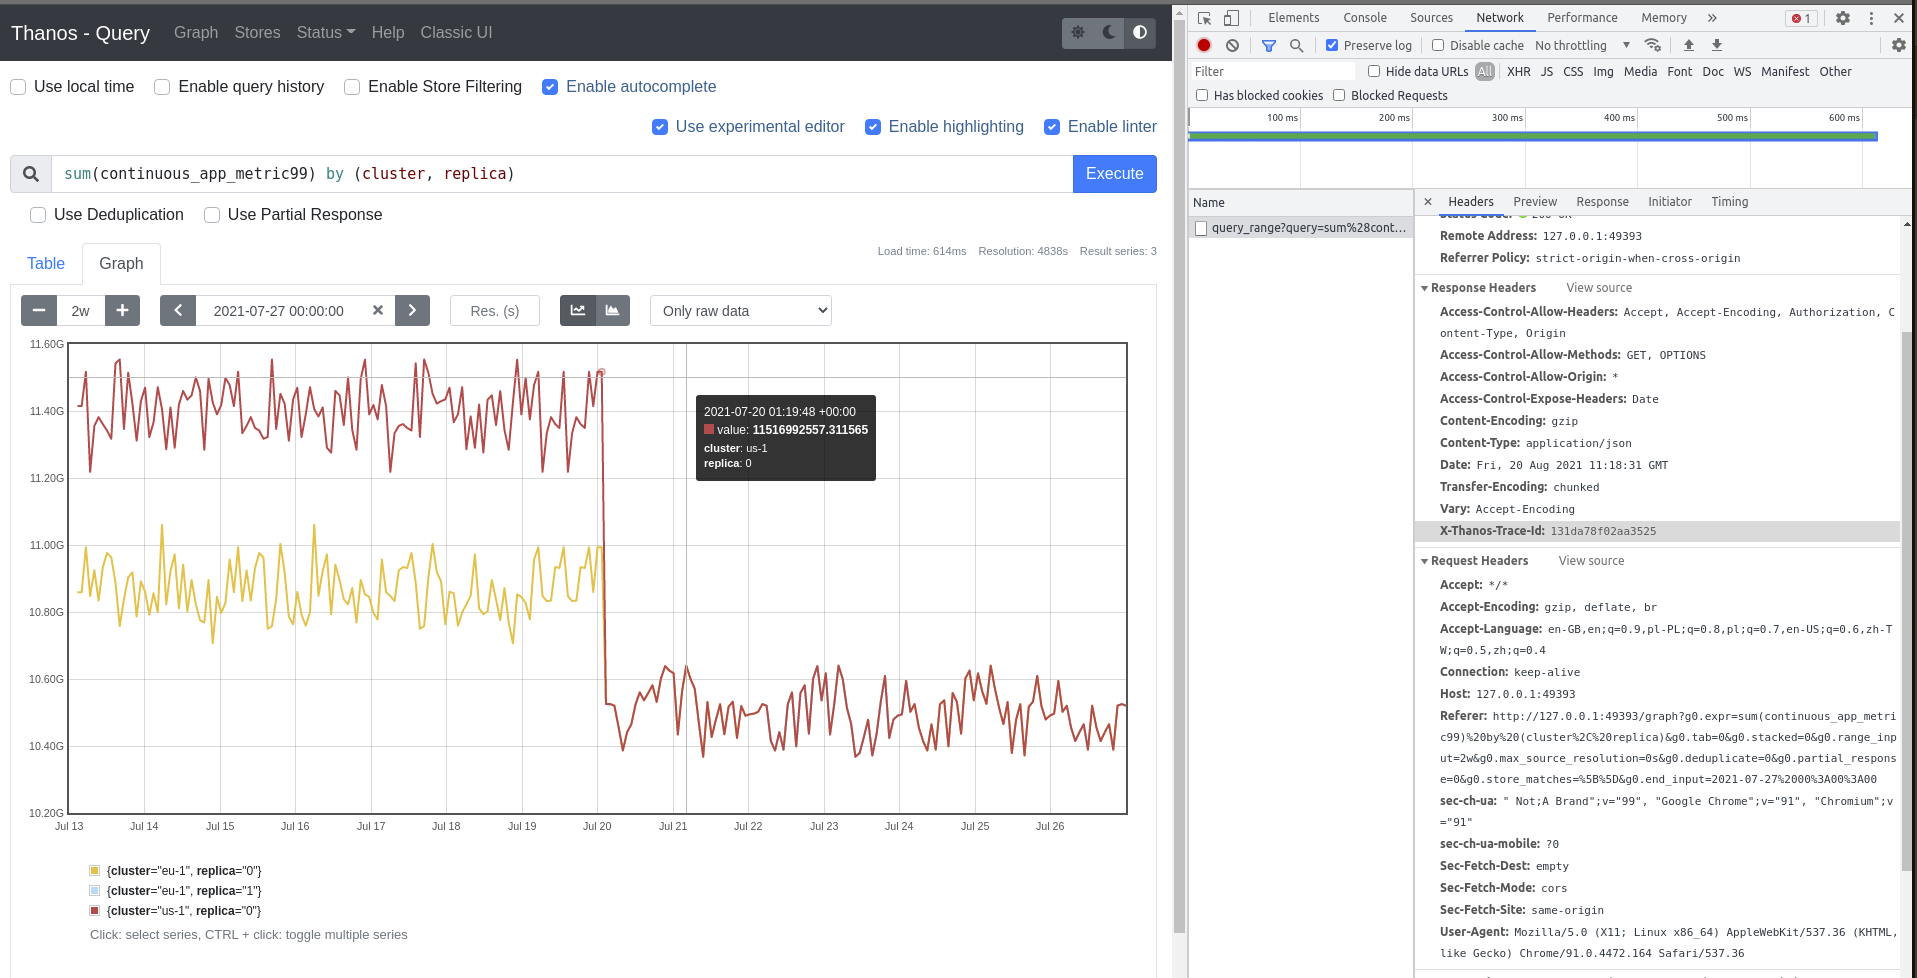
Single trace is tied to a single, unique request to the system and is composed of many spans from different components. Trace is identifiable using Trace ID, which is a unique hash e.g 131da78f02aa3525. This information can be also referred as request id and operation id in other systems. In order to use trace data you want to find trace IDs that explains the requests you are interested in e.g request with interesting error, or longer latency, or just debug call you just made.
When using tracing with Thanos, you can obtain trace ID in multiple ways:
- Search by labels/attributes/tags/time/component/latency e.g. using Jaeger indexing.
- Exemplars
- If request was sampled, response will have
X-Thanos-Trace-Idresponse header with trace ID of this request as value.
Forcing Sampling #
Every request against any Thanos component’s API with header X-Thanos-Force-Tracing will be sampled if tracing backend was configured.
Configuration #
Currently supported tracing backends:
OpenTelemetry (OTLP) #
Thanos supports exporting traces in the OpenTelemetry Protocol (OTLP). Both gRPC and HTTP clients are supported. Options can be provided also via environment variables. For more details see the exporter specification.
type: OTLP
config:
  client_type: ""
  service_name: ""
  resource_attributes: {}
  reconnection_period: 0s
  compression: ""
  insecure: false
  endpoint: ""
  url_path: ""
  timeout: 0s
  retry_config:
    retry_enabled: false
    retry_initial_interval: 0s
    retry_max_interval: 0s
    retry_max_elapsed_time: 0s
  headers: {}
  tls_config:
    ca_file: ""
    cert_file: ""
    key_file: ""
    server_name: ""
    insecure_skip_verify: false
  sampler_type: ""
  sampler_param: ""
Jaeger #
Client for https://github.com/jaegertracing/jaeger tracing. Options can be provided also via environment variables. For more details see the Jaeger exporter specification.
WARNING: Options RPC Metrics, Gen128Bit and Disabled are now deprecated and won’t have any effect when set
type: JAEGER
config:
  service_name: ""
  disabled: false
  rpc_metrics: false
  tags: ""
  sampler_type: ""
  sampler_param: 0
  sampler_manager_host_port: ""
  sampler_max_operations: 0
  sampler_refresh_interval: 0s
  sampler_parent_config:
    local_parent_sampled: false
    remote_parent_sampled: false
  sampling_server_url: ""
  operation_name_late_binding: false
  initial_sampler_rate: 0
  reporter_max_queue_size: 0
  reporter_flush_interval: 0s
  reporter_log_spans: false
  reporter_disable_attempt_reconnecting: false
  reporter_attempt_reconnect_interval: 0s
  endpoint: ""
  user: ""
  password: ""
  agent_host: ""
  agent_port: 0
  traceid_128bit: false
Google Cloud (formerly Stackdriver) #
Client for https://cloud.google.com/trace/ tracing.
You will also need to ensure that the authentication with the API is working, follow this guide to set it up.
Note: The type in the configuration below can have either value GOOGLE_CLOUD or STACKDRIVER - this is to ensure backwards compatibility.
type: GOOGLE_CLOUD
config:
  service_name: ""
  project_id: ""
  sample_factor: 0
Elastic APM #
Client for https://www.elastic.co/products/apm tracing.
type: ELASTIC_APM
config:
  service_name: ""
  service_version: ""
  service_environment: ""
  sample_rate: 0
Lightstep #
Client for Lightstep.
In order to configure Thanos to interact with Lightstep you need to provide at least an access token in the configuration file. The collector key is optional and used when you have on-premise satellites.
type: LIGHTSTEP
config:
  access_token: ""
  collector:
    scheme: ""
    host: ""
    port: 0
    plaintext: false
    custom_ca_cert_file: ""
  tags: ""
Found a typo, inconsistency or missing information in our docs? Help us to improve Thanos documentation by proposing a fix on GitHub here ❤️